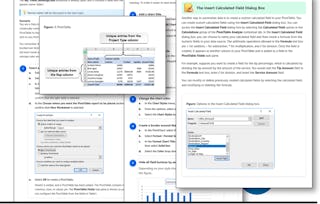
We are now living in the age of big data. Data is being collected all the time and for increasingly detailed transactions. This can lead to an overwhelming amount of data, which brings about a need for people who can analyze large amounts of data quickly. Fortunately, Microsoft® Excel® provides Power Pivot to help you organize, manipulate, and report on your data in the best way possible. Since a tool is only as good as the person using it, it is important to gain a solid understanding of Power Pivot to maximize your effectiveness when analyzing data.
Microsoft Excel: Data Analysis with Power Pivot
Microsoft Excel: Data Analysis with Power Pivot
This course is part of Microsoft Excel 365: From Zero to Mastery Specialization

Instructor: Bill Rosenthal
Included with
Gain insight into a topic and learn the fundamentals.
5 hours to complete
Flexible schedule
Learn at your own pace
What you'll learn
In this course, you will use Power Pivot along with Excel to analyze data from a variety of sources.
Skills you'll gain
- Time Series Analysis and Forecasting
- Cloud-Based Integration
- Performance Measurement
- Data Modeling
- Key Performance Indicators (KPIs)
- Trend Analysis
- Pivot Tables And Charts
- Data Presentation
- Spreadsheet Software
- Performance Reporting
- Data Analysis Expressions (DAX)
- Data Manipulation
- Data Analysis
- Data Visualization Software
- Data Integration
Tools you'll learn
Details to know

Shareable certificate
Add to your LinkedIn profile
Recently updated!
January 2026
Assessments
1 assignment
Taught in English
See how employees at top companies are mastering in-demand skills

Build your subject-matter expertise
This course is part of the Microsoft Excel 365: From Zero to Mastery Specialization
When you enroll in this course, you'll also be enrolled in this Specialization.
- Learn new concepts from industry experts
- Gain a foundational understanding of a subject or tool
- Develop job-relevant skills with hands-on projects
- Earn a shareable career certificate

There are 4 modules in this course
Earn a career certificate
Add this credential to your LinkedIn profile, resume, or CV. Share it on social media and in your performance review.
Instructor
Offered by
Explore more from Business Essentials
 Status: Free Trial
 Status: Free Trial
Macquarie University
 Status: Free Trial
Logical Operations
 Status: Free Trial
Logical Operations
Why people choose Coursera for their career

Felipe M.
Learner since 2018
"To be able to take courses at my own pace and rhythm has been an amazing experience. I can learn whenever it fits my schedule and mood."

Jennifer J.
Learner since 2020
"I directly applied the concepts and skills I learned from my courses to an exciting new project at work."

Larry W.
Learner since 2021
"When I need courses on topics that my university doesn't offer, Coursera is one of the best places to go."

Chaitanya A.
"Learning isn't just about being better at your job: it's so much more than that. Coursera allows me to learn without limits."


